NILRA Detention Tracker Site Description
The Detention Mapping with ICE Data monthly reports give an overview of the publicly available ICE detention management data. These reports are part of a series of regularly generated reports updating and highlighting continuity and change in these data as they are updated and made available by the government.
By analyzing the data in terms of specified intervals, the reports show detention trends over time and thus provide timely insights into ICE enforcement activity.
Key Metrics
The key metrics being mapped, tracked, and visualized in this report include:
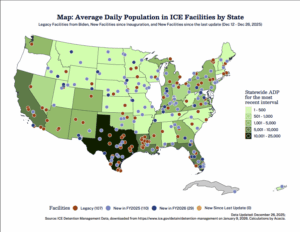
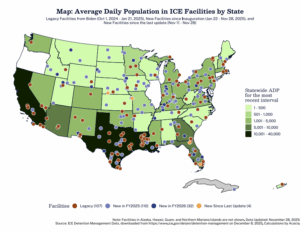
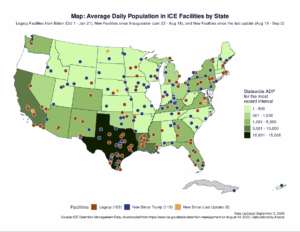
- Average Daily Population: The Average Daily Population in ICE detention facilities for each interval.
- Geographic Distribution of Facilities: The geography of ICE facilities that detained people during FY2025, focusing on newly reported facilities under the Trump administration to date and in the most recent reporting period.
- Facility Type: These metrics are broken down by facilities operated directly by ICE, private immigrant detention centers, county jails, and other facility types.
These reports present metrics for the period from October 1, 2024 (the start of FY2025) through the most recent period for which data have been updated. The period between October 1, 2024, and January 21, 2025, is combined to establish the baseline of the average daily population during the last three months of the Biden administration.
We hope these reports serve as a timely resource for understanding shifts in the magnitude and geographic distribution of ICE detention practices and provide clarity on how detention trends evolve over time.